GonnaOrder provides you with a variety of statistical information about orders submitted to your store. There is a lot to know, from menu viewings to the number of orders confirmed within a certain period and the total values of all orders placed within the said time. Further, you can either choose to view daily statistics or monthly statistics depending on what is more insightful for you. All this information is available under the Statistics menu, which you can access from the administration interface.
On This Page
- Statistics Time Frame and Structure
- Switch Between Monthly and Daily Statistics Statistics
- Monthly Statistics
- Daily Statistics
Statistics Time Frame and Structure
The statistics time frame is the base period for which statistical data from your store is presented on our statistics portal. The base period can either be days or months. When working with days, you can view data from up to but not more than 30 days or the equivalent number of days in the current month. On the other hand, you can view monthly statistics for up to twelve months.
For either of the two cases, you have to choose a starting date or month. This will automatically select the end date/month for which the statistics will be shown. If you choose to view daily statistics, the end date will be determined by adding 30 days to the start date. The reverse is true, where the starting date will be auto-selected based on these criteria.
To select a starting or end date for the statistics, go to your store dashboard and select Statistics from the side menu. Next, you need to choose the appropriate time frame period based on which the statistical data will be presented. This can either be Monthly or Daily.
All the items in the statistics support two views: the graphical view and the tabular format for daily and monthly statistics.
- The graphical view shows a graph/trend of the statistics over the given period with one entry per month/day. This will help you analyze your order flow and compare the current statistics period and the previous ones. You can also set your targets or trend based on these monthly/daily charts.
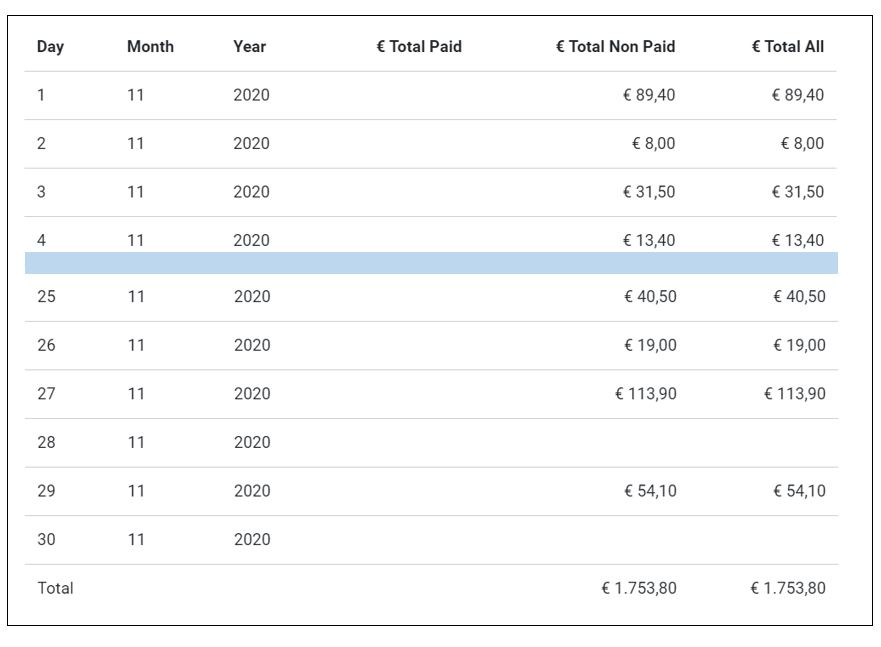
- For those who want to view the exact values, you can find them in tabular format. The results are shown in table format with a row per month/day. You can learn your store’s performance
by comparing values on different rows.
On the statistics dashboard, you can view the total number of orders, the total number of times your menu was viewed, and the total monetary value of all orders placed in your store for the selected statistics period.
Switch Between Monthly and Daily Statistics Statistics
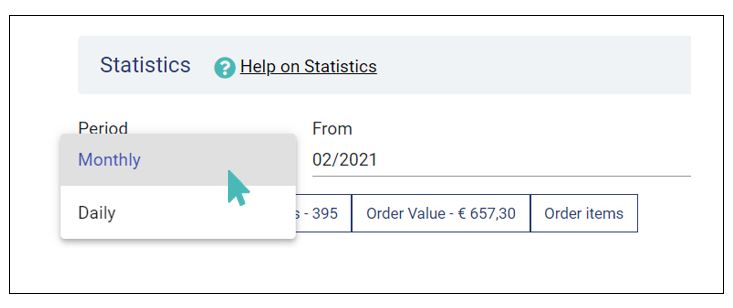
You can view monthly or daily statistics based on the period field. When you select daily, you can view statistics of up to 30 days, but GonnaOrder will default to the number of days in the chosen month. That is to say, choosing 1st February 2021 for the statistics start date will auto-select the 28th day of the same month as the end date for the statistics. On the other hand, monthly statistics can be presented for a period of up to 12 months based on the From and To date selection fields. By default, the period of the last 12 months is selected, but you can change this to suit your needs.
Click on the drop-down caret symbol under the Period field to switch between monthly and daily statistics. Choose between Monthly and Daily options, and your statistics views should change automatically.
Monthly Statistics
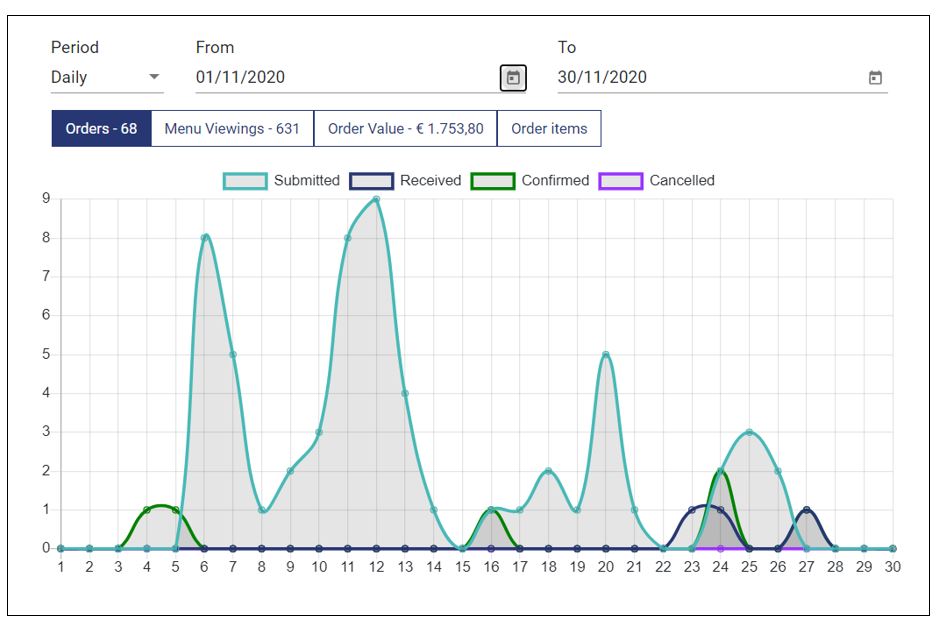
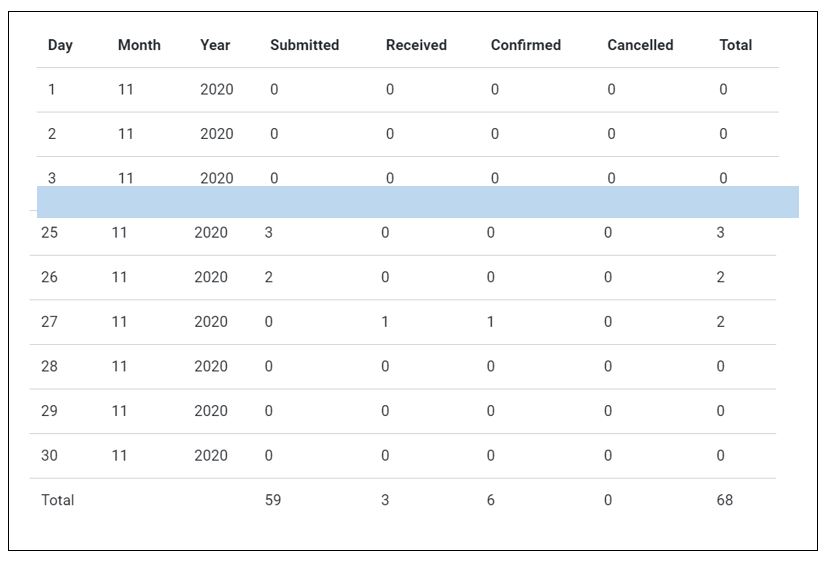
Number of Orders per Month
The first tab of the statistics page shows the orders in their different statuses. On the top of the tab, you can see the total number of orders placed in your store during your selected statistics period.
The order statuses that are available are described below:
- Submitted – A customer has submitted these orders, but no user has opened them yet in the order dashboard. These orders are still in the open orders list of the orders dashboard.
- Received – A user has opened these orders in the order dashboard but has not confirmed them yet.
- Confirmed – A user has viewed these orders and accepted them for processing.
- Cancelled – A user has rejected these orders and has marked them as Rejected.
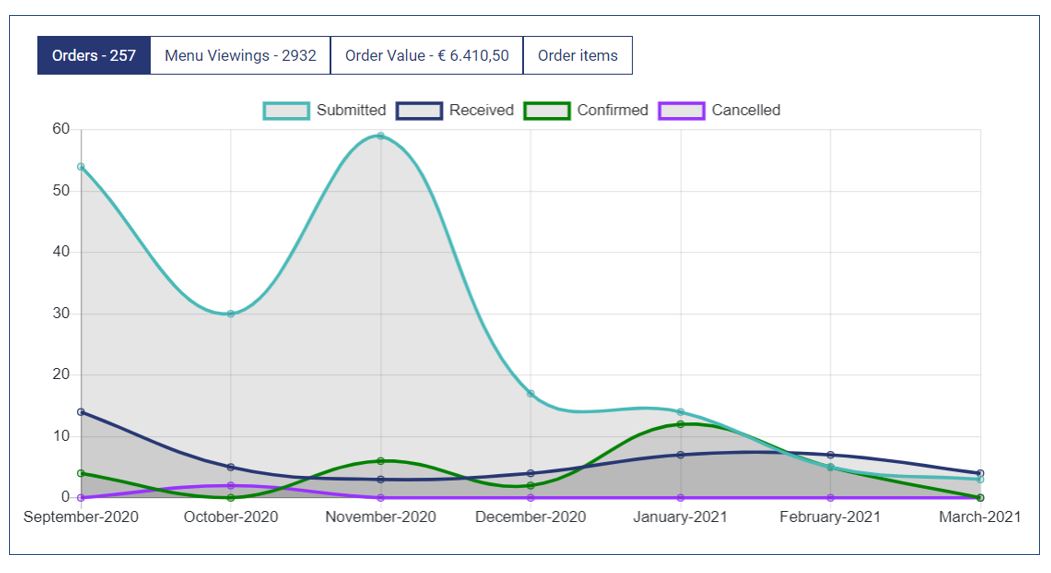
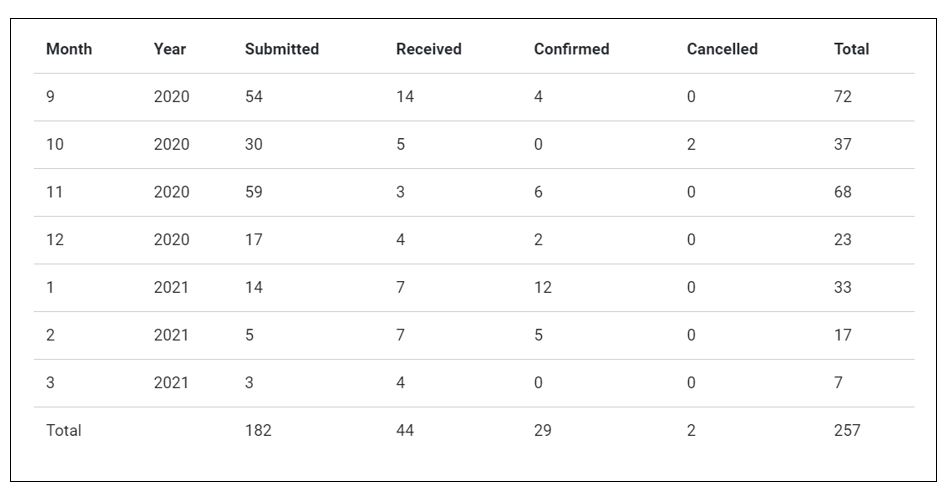
For further explanation of the different order statuses, see help on Orders
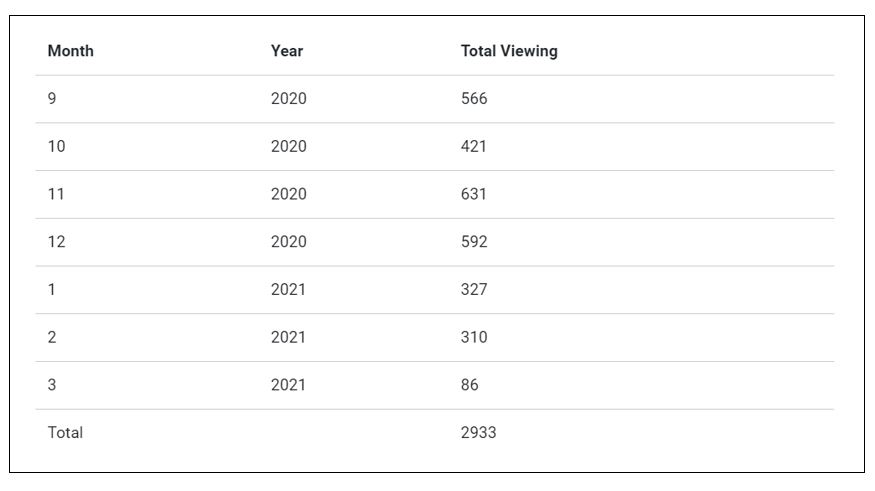
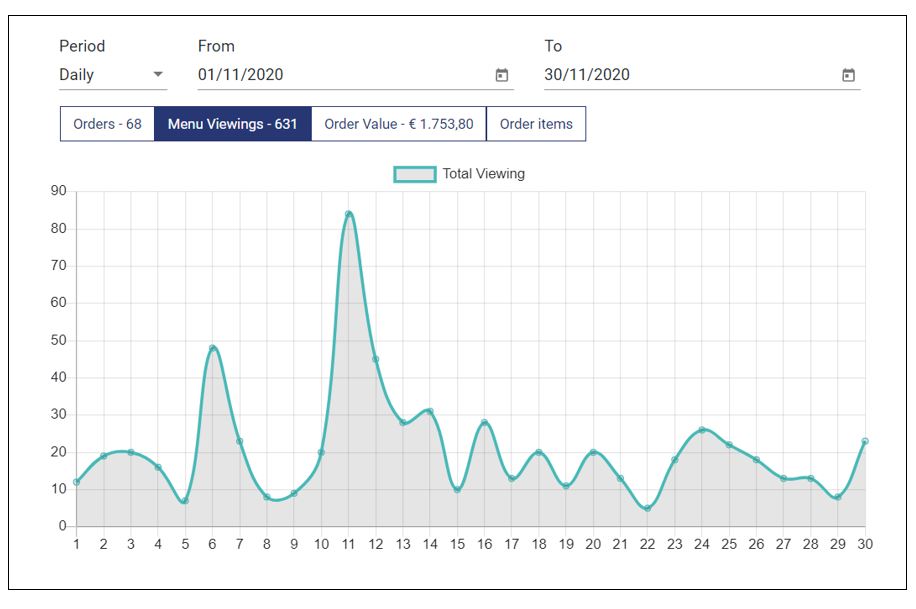
Number of Menu Viewings per Month
The menu Viewings tab shows the number of customers who have used the application to explore the menu of your store without placing an order. Every menu viewing counts once for every visit to the site on the same day from the same device.
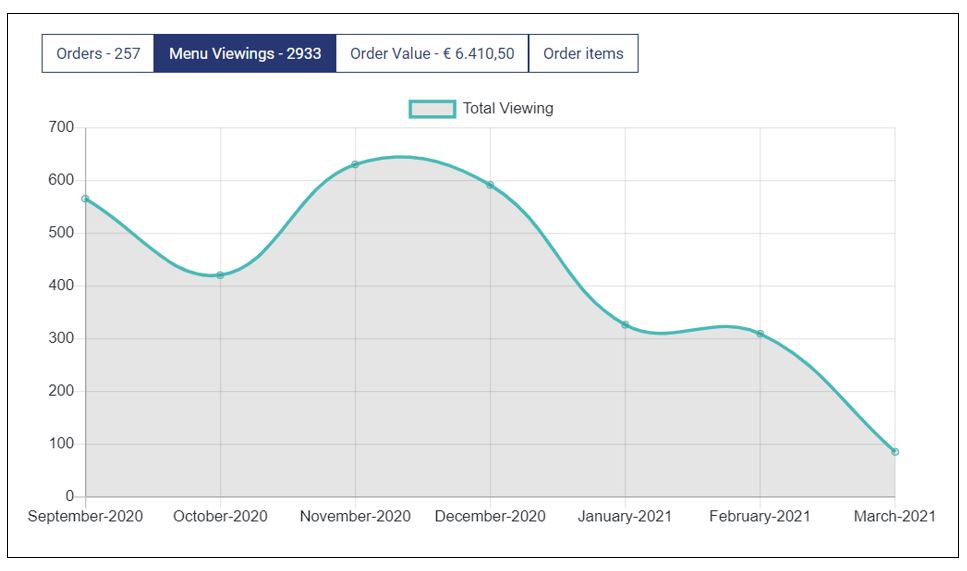
Have a look at the examples below to understand how GonnaOrder counts the menu viewings:
- Multiple visits on the same day using the same device: A user views the website and returns from the same device after 1 hour and doesn’t place an order. This counts as one menu viewing from the same device for the same day.
- Visit that results to an order: A user views the website and places an order. This does not count as a menu viewing but as an order.
- Visit using a different device on the same day: A user views the website from their mobile phone and then views it after a minute from a tablet and doesn’t place an order. This counts as 2 menu viewings as it involves different devices.
- Visit on two different days without placing an order: A user views the website without placing an order and returns after 2 days without placing an order. This counts as 2 menu viewings as it occurs on 2 different days.
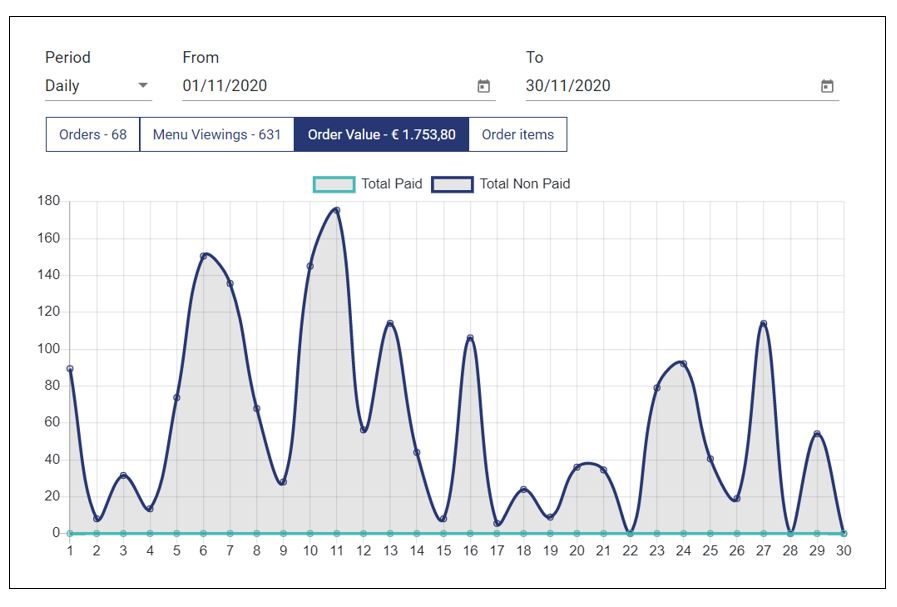
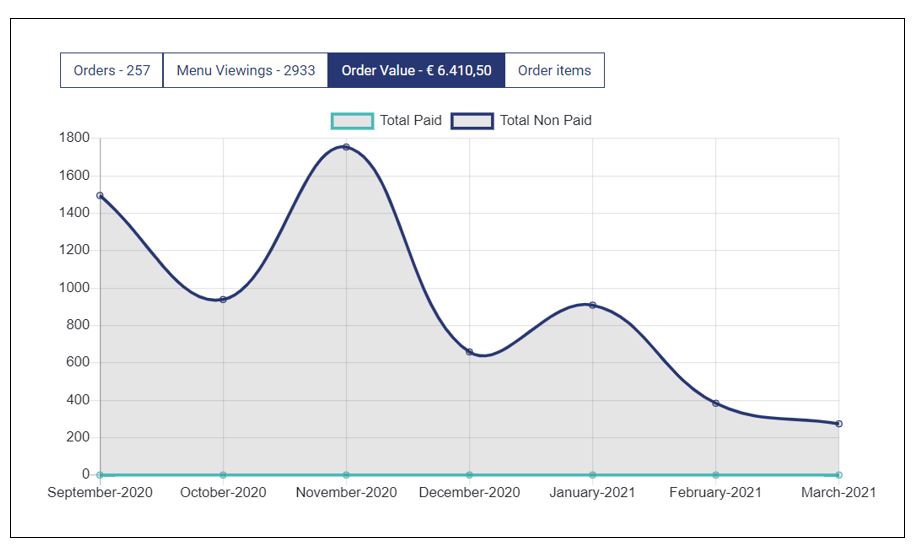
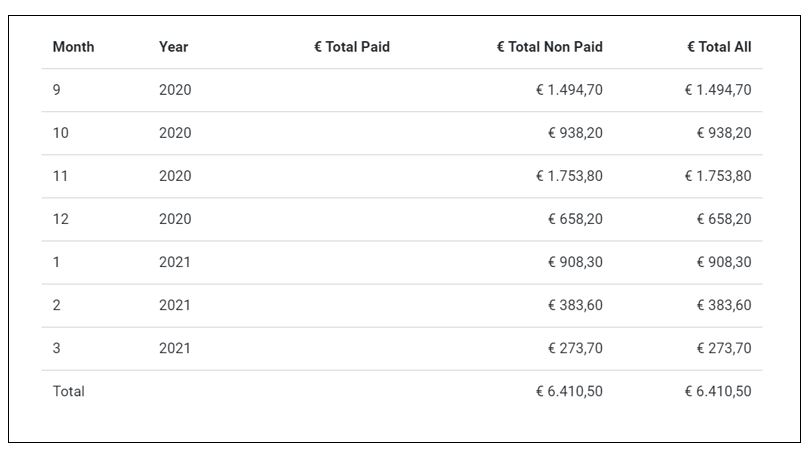
Order Value Per Month
The Order Value tab displays statistics on the total value of orders placed via GonnaOrder. On the tab on the top, you can see the total monetary amount of the orders. If you have enabled online payments for your store, you will see the split between the orders paid online and not paid online.
You will also find the statistics on the orders of your store which were not paid marked as Total Non-Paid. Your store will definitely have different statistics, and the images provided on this page should only act as a guide.
Daily Statistics
Daily statistics are more the same as the monthly statistics except that they are based on individual days rather than months. As we have previously mentioned, you can view daily statistics for a period equivalent to one month. Further, daily statistics are also presented using both graphs and tables like we have shown the monthly statistics. All other explanations we made for monthly statistics will hold for daily statistics too.
Daily Orders
This will show you the number of orders that arrived in your store daily within your chosen statistics period.
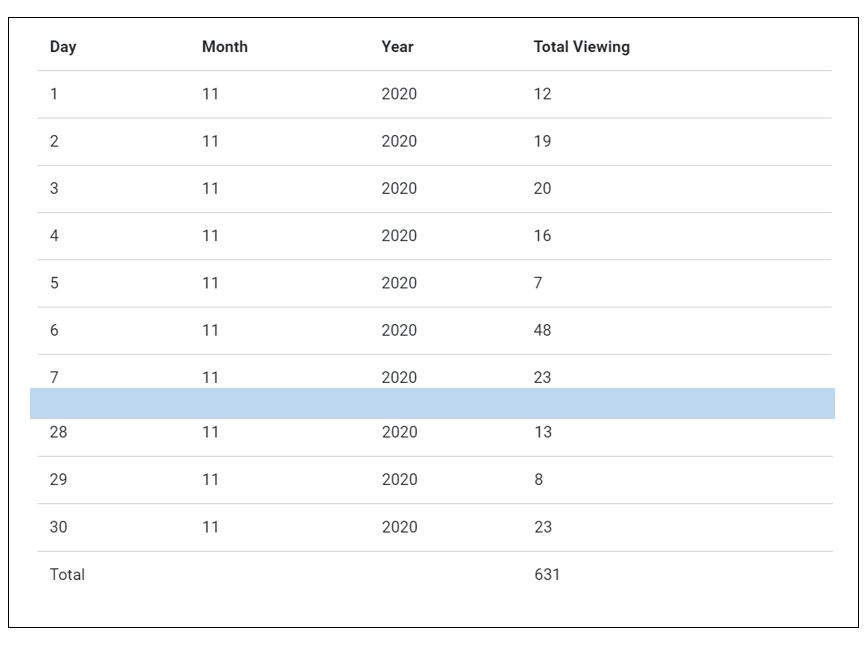
Daily Menu Viewings
This section will show you the number of times customers viewed your menu every day during the statistics period you have selected. You will also see the total number of viewings for the whole period on the menu viewings statistics table.
Daily Order Values
This will be the total value of all orders placed in your store during particular days within your statistics period. If you have activated online payments for your store, you will see two line graphs where one represents the values paid online and others that were either paid offline or not paid at all. The statistics table for this will show you the total value of all paid and non-paid orders for all days included in your statistics period.